Over the past few months, as part of my Covid-19 pandemic reporting, I have frequently used data and graphics to supplement my coverage. Here is a selection of my work. Click on each image for an interactive version.
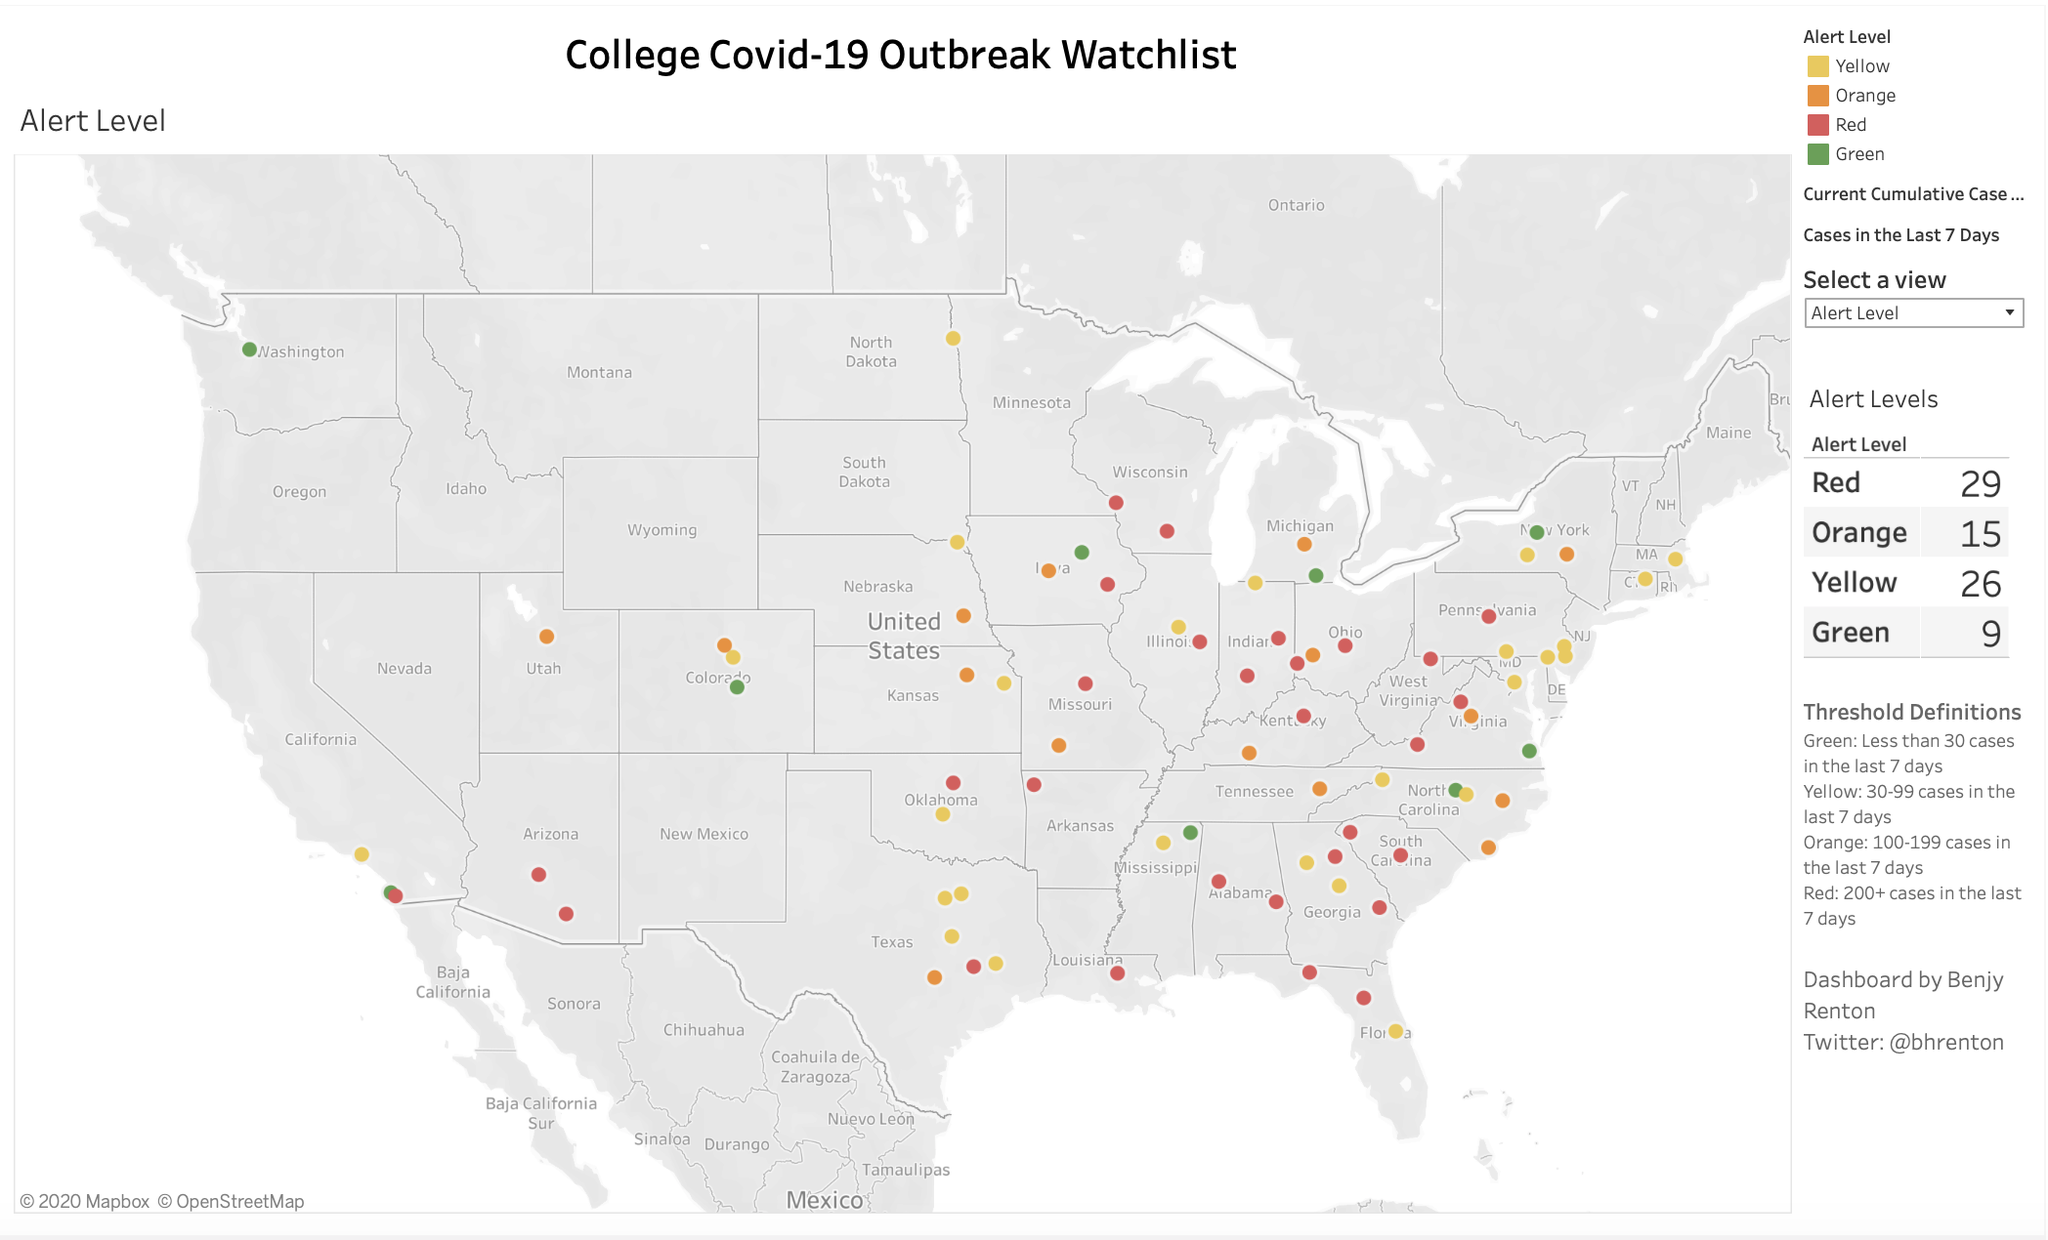
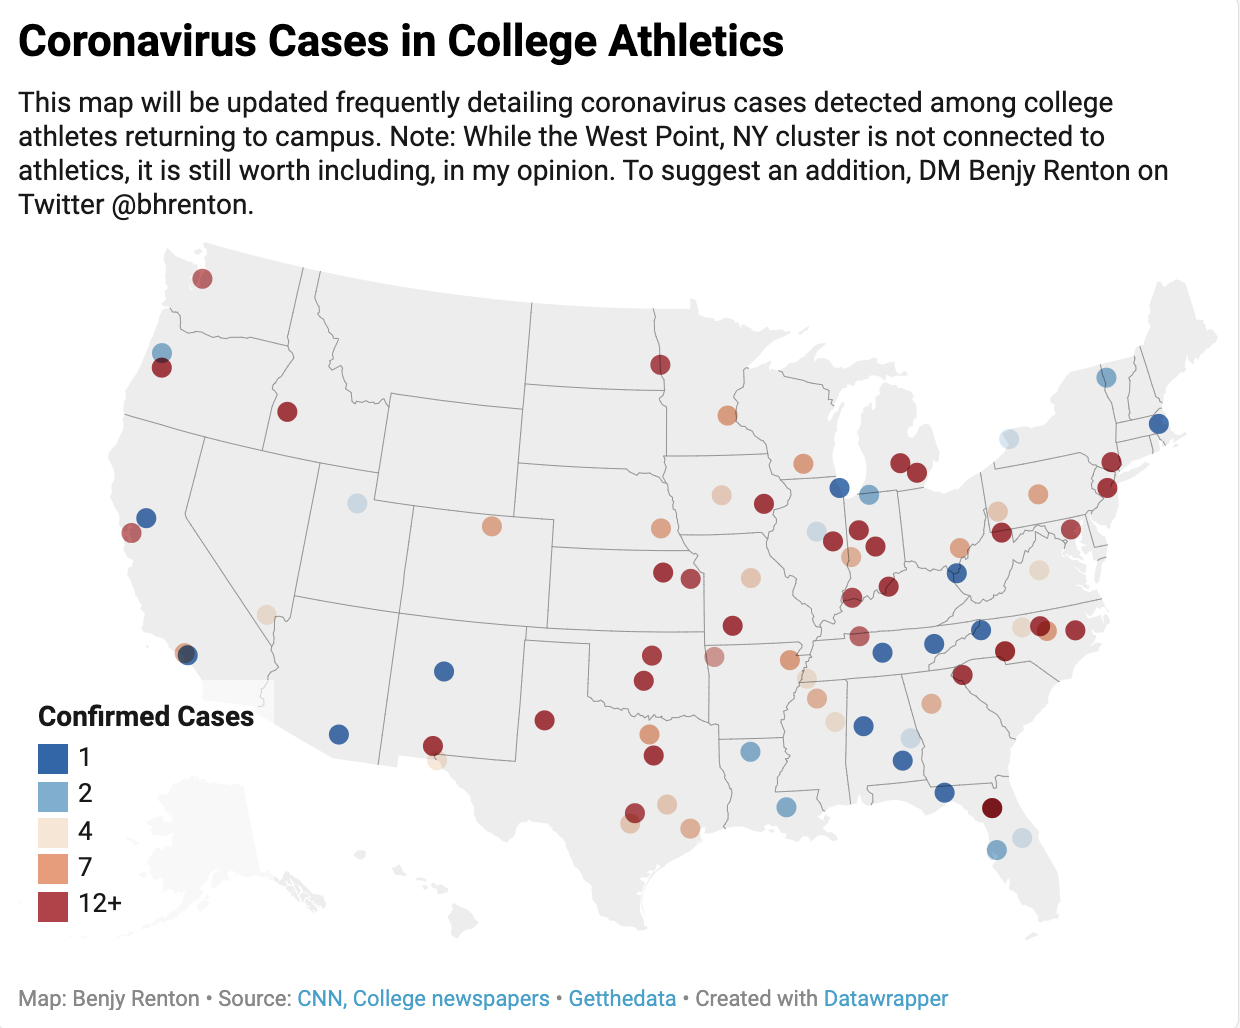
<a href='#'><img alt=' ' src='<img class="redactor-autoparser-object" src="<img class="redactor-autoparser-object" src="<img class="redactor-autoparser-object" src="https://public.tableau.com/static/images/Co/CollegeCovid-19OutbreakWatchlist/CollegeCovid-19OutbreakWatchlist/1_rss.png">">">' style='border: none' /></a>
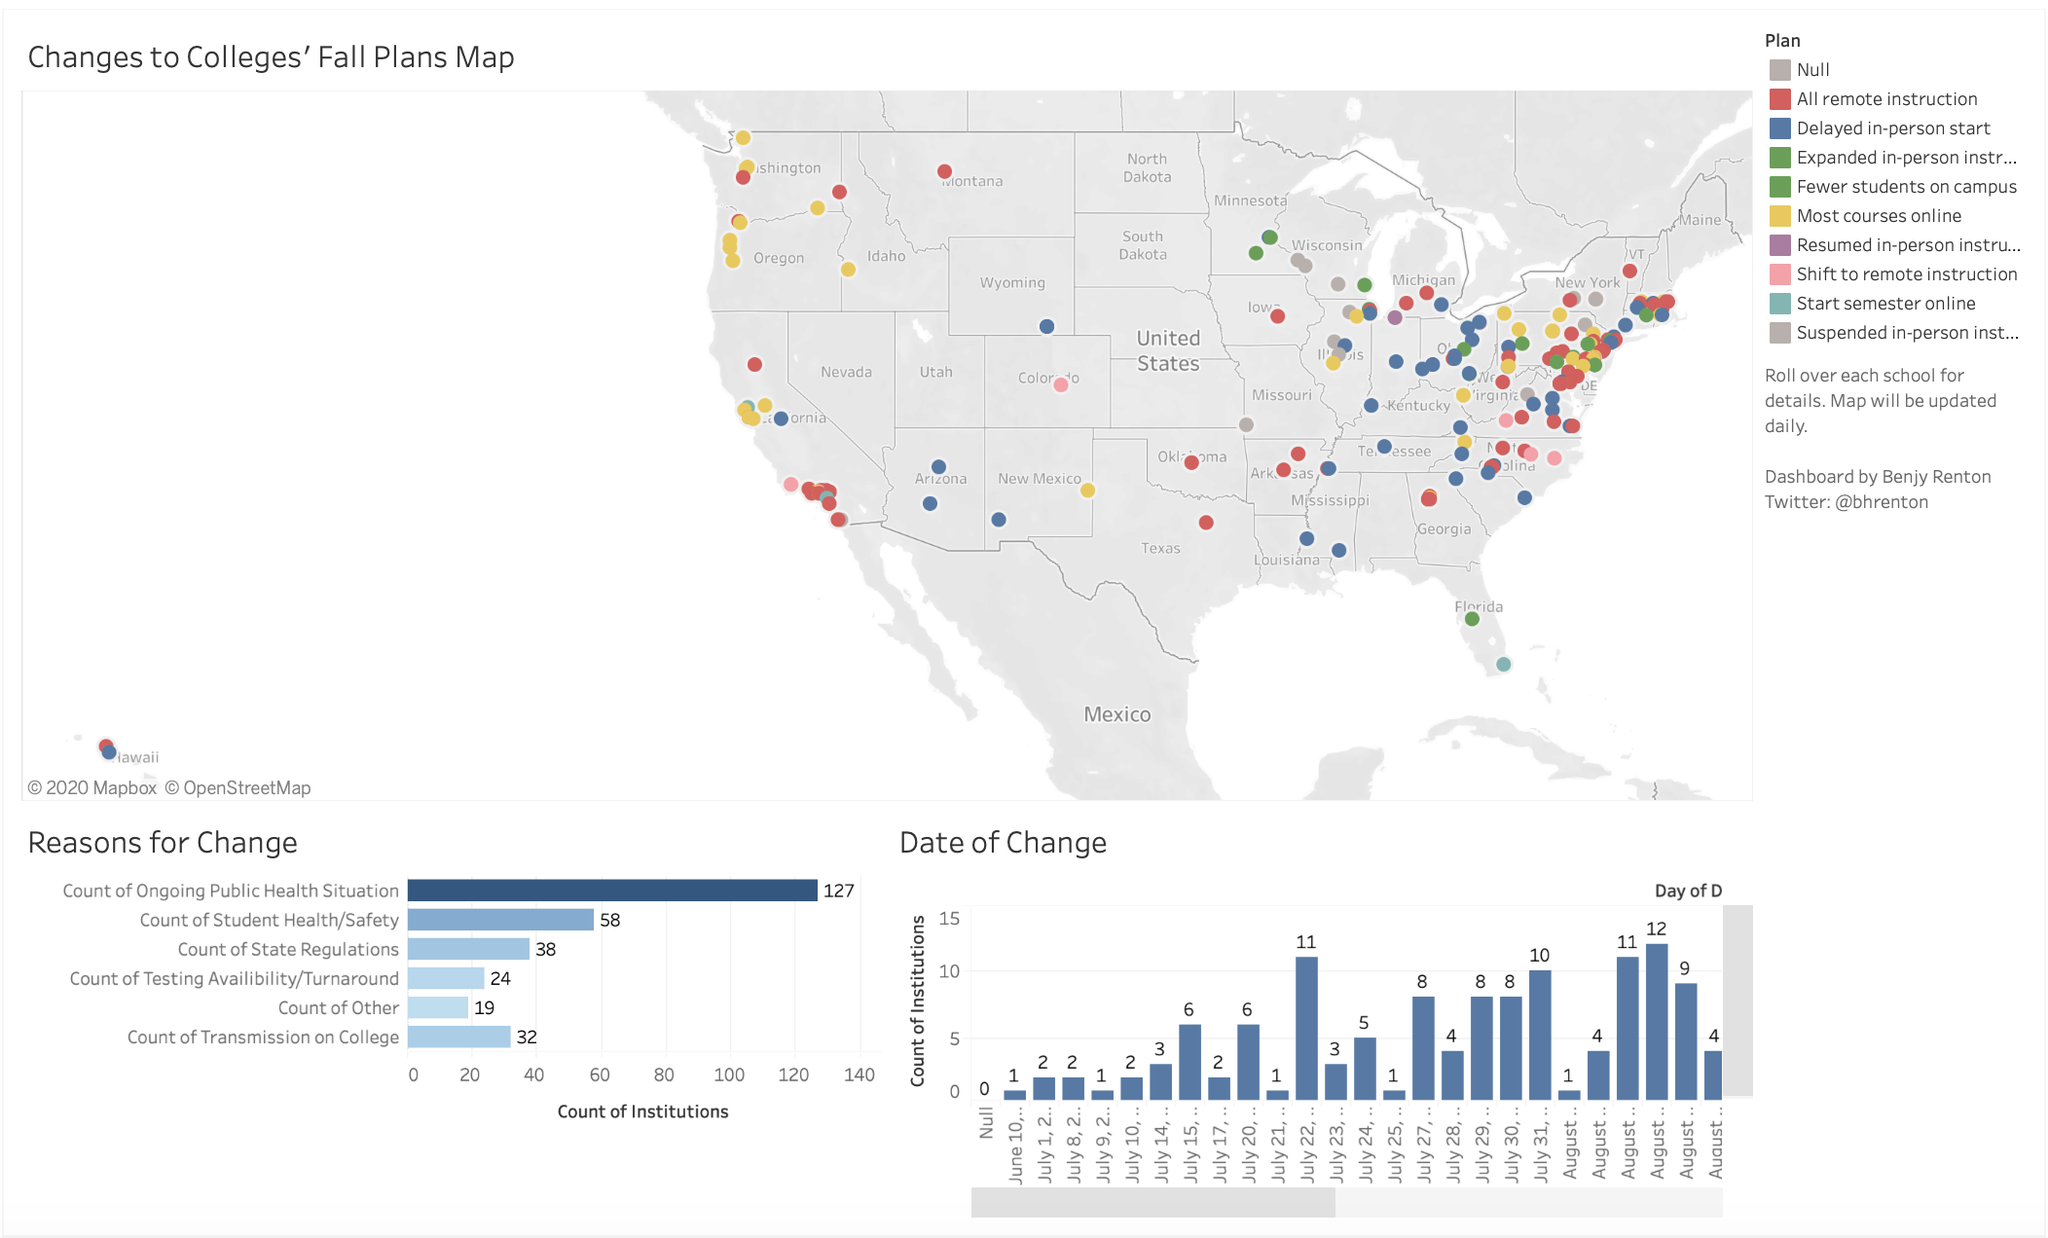
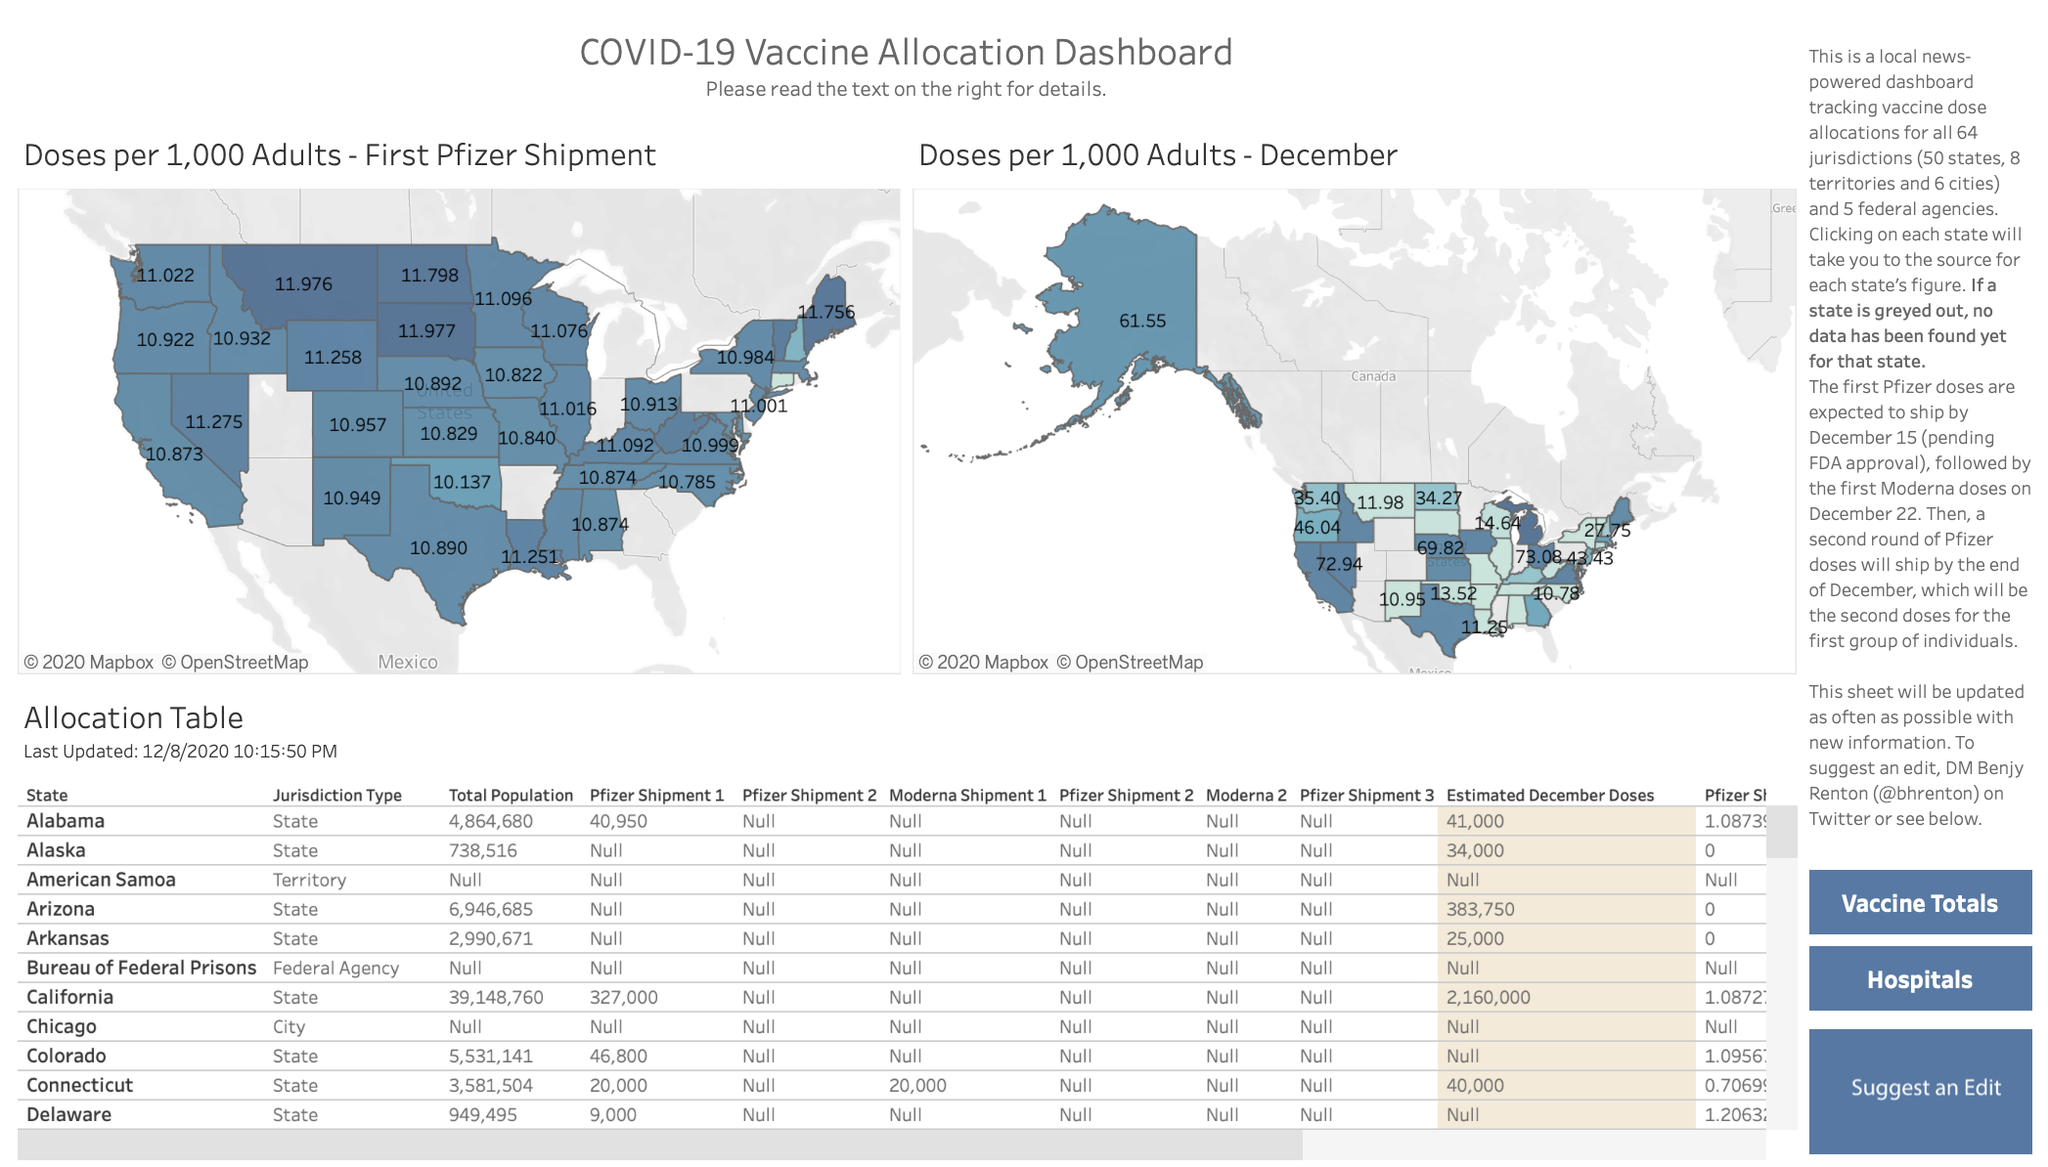
<a href='#'><img alt=' ' src='<img class="redactor-autoparser-object" src="<img class="redactor-autoparser-object" src="<img class="redactor-autoparser-object" src="https://public.tableau.com/static/images/Ch/ChangestoCollegesFallPlans/ChangestoCollegesFallPlans/1_rss.png">">">' style='border: none' /></a>